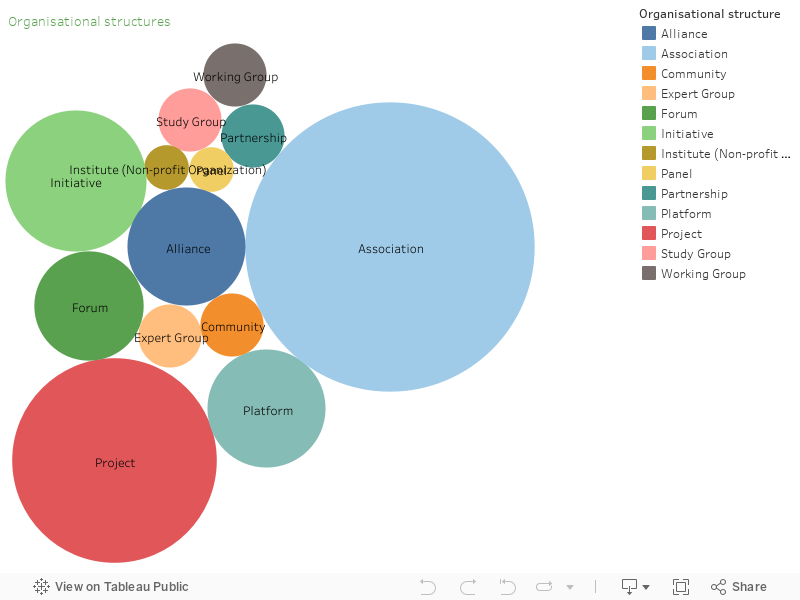
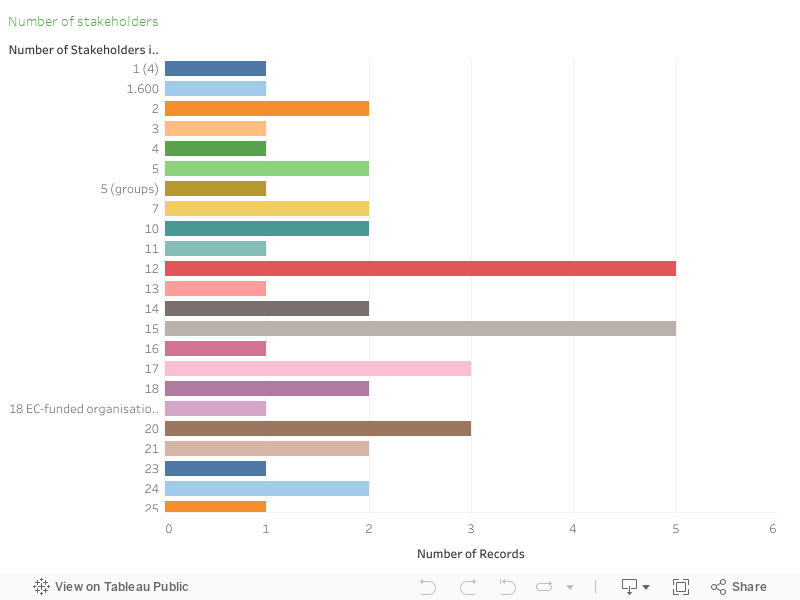
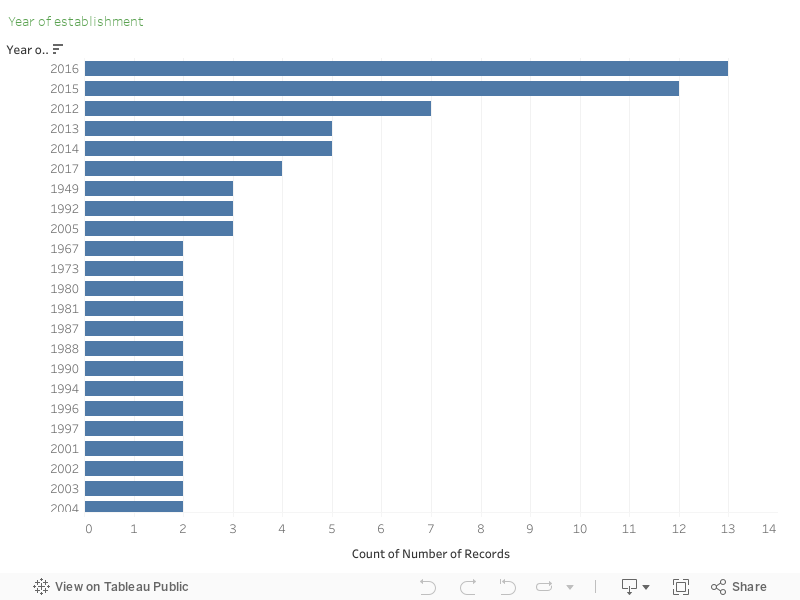
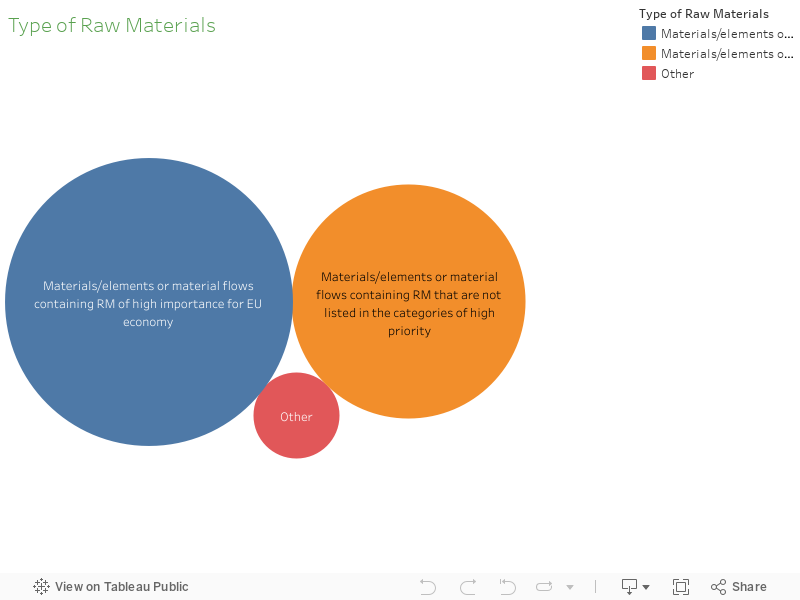
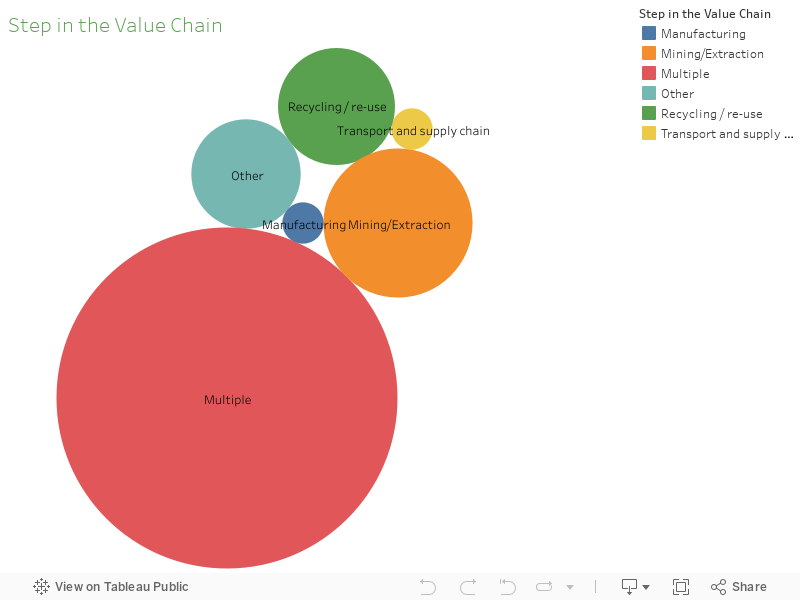
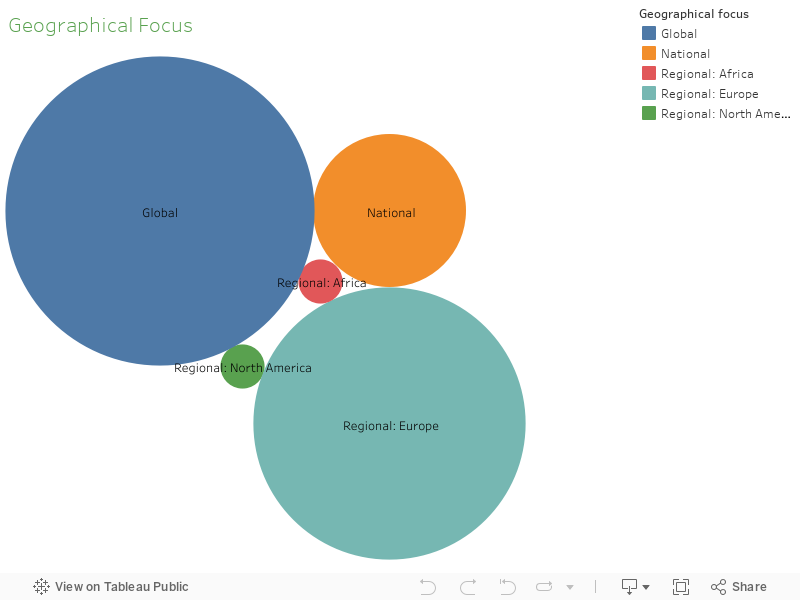
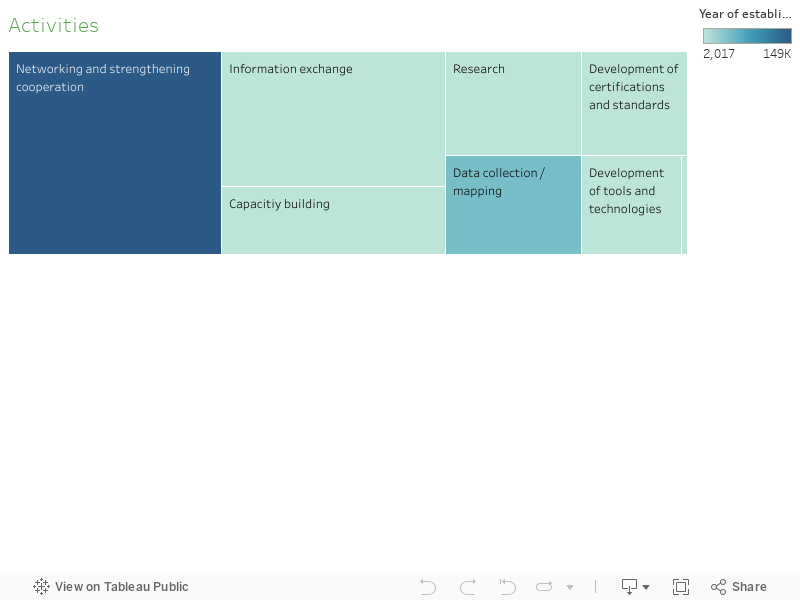
The graphs on this page provide an overview of the different characteristics of the initiatives mapped by the FORAM project. The graphs illustrate the initiatives’ ‘Organisational Structures’, ‘Number of Stakeholders’, ‘Year of Establishment’, ‘Step in the Value Chain’, ‘Objectives and Strategies’, and ‘Activities’. The size of the categories of these characteristics in the graphs is linked to the number of initiatives.